Key takeaways
- FX markets have remained subdued following the US Supreme Court’s ruling on emergency tariff powers.
- With the USD likely to drift lower, the JPY, CAD, and NZD should remain steady for now.
- The EUR and AUD look set to strengthen, while the GBP may come under more pressure.
Our tactical view
Table of tactical views where a currency pair is referenced (e.g. USD/JPY):An up (⬆) / down (⬇) / sideways (➡) arrow indicates that the first currency quotedin the pair is expected by HSBC Global Research to appreciate/depreciate/track sideways against the second currency quoted over the coming weeks. For example, an up arrow against EUR/USD means that the EUR is expected to appreciate against the USD over the coming weeks. The arrows under the “current” represent our current views, while those under “previous” represent our views in the last month’s report.
Note: ^DXY = US Dollar Index, is an index (or measure) of the value of the USD against major global currencies, including the EUR, JPY, GBP, CAD, SEK and CHF. N/A = Not applicable, as we only provide short-term direction for those currency pairs from this issue. Source: HSBC
FX Data Snapshot
| FX |
Spot |
200 dma |
1-month % change* |
Support |
Resistance |
|---|---|---|---|---|---|
| DXY |
97.92 | 98.41 | 0.33% | 96.50 | 99.50 |
| EUR-USD |
1.1780 | 1.1659 | -0.84% | 1.1651 | 1.1930 |
| EUR-GBP | 0.8738 | 0.8668 | -0.62% | 0.8663 | 0.8865 |
| GBP-USD | 1.3481 | 1.3447 | -1.45% | 1.3280 | 1.3750 |
| USD-JPY |
155.93 | 150.88 | -1.12% | 152.10 | 157.80 |
| EUR-JPY | 183.68 | 175.93 | -0.28% | 180.80 | 185.50 |
| USD-CHF |
0.7755 | 0.7988 | 0.18% | 0.7600 | 0.7860 |
| EUR-CHF | 0.9136 | 0.9312 | 1.02% | 0.9000 | 0.9330 |
| USD-CAD | 1.3702 | 1.3809 | 0.04% | 1.3500 | 1.3930 |
| AUD-USD |
0.7068 | 0.6612 | 2.18% | 0.7000 | 0.7150 |
| AUD-NZD | 1.1853 | 1.1258 | -2.32% | 1.1680 | 1.2000 |
| NZD-USD |
0.5964 | 0.5875 | -0.17% | 0.5880 | 0.6100 |
| FX |
DXY |
|---|---|
| Spot |
97.92 |
| 200 dma |
98.41 |
1-month % change* |
0.33% |
| Support |
96.50 |
| Resistance | 99.50 |
| FX |
EUR-USD |
| Spot |
1.1780 |
| 200 dma |
1.1659 |
1-month % change* |
-0.84% |
| Support |
1.1651 |
| Resistance | 1.1930 |
| FX |
EUR-GBP |
| Spot |
0.8738 |
| 200 dma |
0.8668 |
1-month % change* |
-0.62% |
| Support |
0.8663 |
| Resistance | 0.8865 |
| FX |
GBP-USD |
| Spot |
1.3481 |
| 200 dma |
1.3447 |
1-month % change* |
-1.45% |
| Support |
1.3280 |
| Resistance | 1.3750 |
| FX |
USD-JPY |
| Spot |
155.93 |
| 200 dma |
150.88 |
1-month % change* |
-1.12% |
| Support |
152.10 |
| Resistance | 157.80 |
| FX |
EUR-JPY |
| Spot |
183.68 |
| 200 dma |
175.93 |
1-month % change* |
-0.28% |
| Support |
180.80 |
| Resistance | 185.50 |
| FX |
USD-CHF |
| Spot |
0.7755 |
| 200 dma |
0.7988 |
1-month % change* |
0.18% |
| Support |
0.7600 |
| Resistance | 0.7860 |
| FX |
EUR-CHF |
| Spot |
0.9136 |
| 200 dma |
0.9312 |
1-month % change* |
1.02% |
| Support |
0.9000 |
| Resistance | 0.9330 |
| FX |
USD-CAD |
| Spot |
1.3702 |
| 200 dma |
1.3809 |
1-month % change* |
0.04% |
| Support |
1.3500 |
| Resistance | 1.3930 |
| FX |
AUD-USD |
| Spot |
0.7068 |
| 200 dma |
0.6612 |
1-month % change* |
2.18% |
| Support |
0.7000 |
| Resistance | 0.7150 |
| FX |
AUD-NZD |
| Spot |
1.1853 |
| 200 dma |
1.1258 |
1-month % change* |
-2.32% |
| Support |
1.1680 |
| Resistance | 1.2000 |
| FX |
NZD-USD |
| Spot |
0.5964 |
| 200 dma |
0.5875 |
1-month % change* |
-0.17% |
| Support |
0.5880 |
| Resistance | 0.6100 |
Note: *Priced as at 15:50 HKT on 24 February 2026.
Source: HSBC, Bloomberg
Explanation of terms
Spot: Spot refers to the current market price of a currency pair that is important for immediate transactions.
200 dma: 200-day simple moving average numberrepresents the average price of an index or a currency pair over the past 200 days.
Support (S), Resistance (R):Support and resistance are significant previous lows and highs plus retracement levels, based on historical price patterns of anindex or a currency pair. Support is a historical price level where a downtrend of a currency pair paused due to demand for the first currency quoted in the pair increasing, while resistance is a historical price level where an uptrend of a currency pair reversed amid demand for the second currency quoted in the pair increasing.
HSBC Positioning Indices
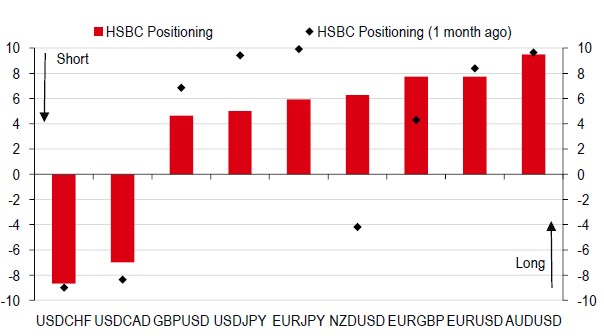
The indicators have been devised to track the net position of momentum traders, looking at hundreds of strategies, operating over many different time horizons. It considers time horizons of 5 days up to 260 days. An indicator level of +10 would indicate that the hundreds of different strategies have all lined up and gone long (i.e., buy the first currency quoted in the pair). Similarly, an indicator level of -10 indicates that all strategies are short (i.e., sell the first currency quoted in the pair).