27 June 2025
Indonesia is in a bit of a lull, waiting for traction from policy by its new government. Tariffs are a bigger concern in Malaysia, even if growth momentum continues to impress. Singapore, too, faces impact from global turmoil. In Thailand, trade uncertainties are compounded by political uncertainty, while the Philippines is looking for another year of solid growth helped by robust domestic spending. It is Vietnam that worries the most in ASEAN about tariffs, though its competitiveness is likely to see it weather it all, eventually.
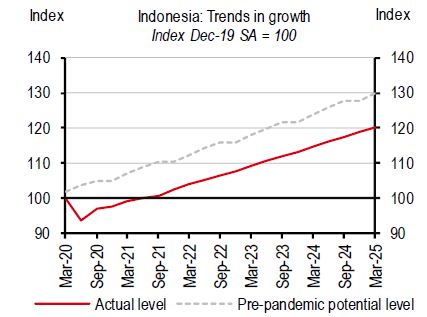
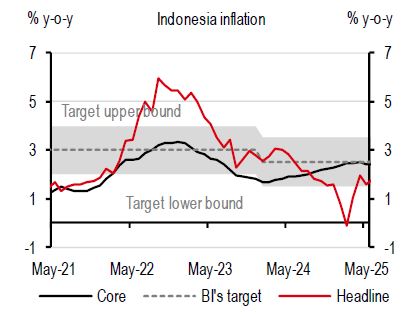
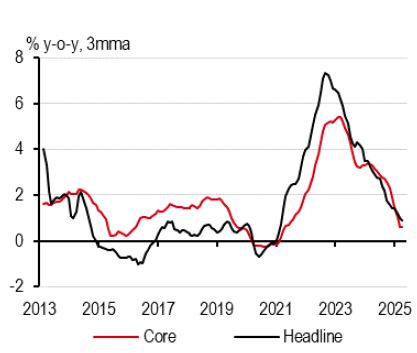
Indonesia’s recovery since the pandemic has been rather soft, led, in part, by tight fiscal and monetary policy over the last few years. 1Q25 GDP came in at 4.9%, weaker than the previous quarter. GDP is now 7.5% lower than the pre-pandemic trend. And, more recently, the April and May manufacturing PMIs dipped into contractionary territory, while bank credit growth and core inflation remain soft. Our now-caster model points to growth of 4.5-5%, lower than the official GDP numbers of about 5%. As such, we see a case for looser fiscal and monetary policy in 2025.
Let’s start with fiscal policy. The government unveiled two separate fiscal stimulus packages over the last few months. The first one, effective from 1 January, included a free food scheme for children, a rice assistance programme, an electricity tariff discount, an accelerated housing programme, and a reduction to planned VAT rate hikes. However, alongside these, the government also announced operational expenditure cuts. Putting the two together, net expenditure growth was not strong, and the government is sitting on higher cash balances than a year ago. More recently, the government announced a second fiscal stimulus package effective from 5 June, incorporating transportation discounts, wage subsidies, discounted insurance cover, food assistance and direct transfers, costing the government 0.1% of GDP. Eventually if the rise in the fiscal deficit is led more by falling revenue than rising expenditure, it may not have large growth multipliers. And growth support would then fall more on the shoulders of monetary easing.
Indonesia also wants to raise potential GDP growth over the medium term. We believe breaking away from commodity price swings by raising geographically diversified and higher value-added exports could bring large gains. Some good things have happened in recent years. Indonesia has gained market share in global exports. However, these haven’t been able to lift domestic growth, as about half of the exports are commodity-related with limited backward linkages. Thankfully, a window of opportunity may open up. Indonesia’s exports to the US look very different, in fact a lot like Vietnam’s export mix, comprised of apparel, footwear, electronics, and furniture. However, these are still rather small (for instance, just 9% of Indonesia’s exports go to the US) and need to be scaled up. Is that doable? It will not be easy, but it is not impossible either. Indonesia doesn’t run a formidable trade surplus with the US, which could arguably protect it from large tariff increases post ongoing negotiations. It could, therefore, benefit from supply chains getting rejigged once again. But, first, Indonesia will have to work hard on several fronts – enhancing infrastructure development, expanding trade agreements, developing a skilled workforce, and streamlining business practices.
What a whirlwind it has been since the tariff “Liberation Day” was announced by the US White House on 2 April. Malaysia, like many ASEAN peers, is facing a dilemma of finding itself being the victim of its own success. The “reciprocal tariff” imposition of 24% on Malaysia has been paused, which was later followed by the US’s sectoral reprieve on electronics imports.
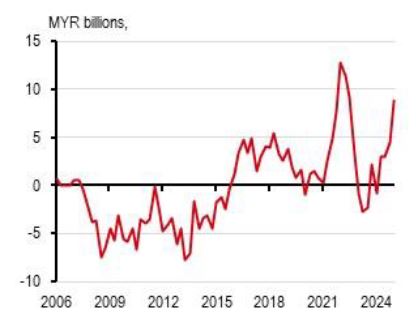
No doubt this is music to the ears of Malaysia, as its exempted electronics shipments to the US alone account for 6% of its GDP, but this may only be temporary. Indeed, tariffs threats loom large over export-oriented economies, particularly those that benefitted from trade tensions under Trump 1.0.
Questions arise whether ASEAN will likely see another reshuffle of FDI relocations between member states, benefitting those with lower tariff rates than Malaysia. We do not believe so. The decision to move FDI is not solely dependent on tariffs, it also reflects a confluence of factors including existing industry clusters, extensive free trade agreements, investment climate, energy supply, and, most crucially, the cost effectiveness of the local labour force. In this case, Malaysia remains in a decent position, unlikely to lose its FDI attractiveness to those with lower tariffs, and even likely to lure some supply chains from peers with higher tariffs. However, significant uncertainty puts investors on a cautious footing with respect to new disbursements, at least in the near term, likely exacerbating the trade shocks.
While the market’s attention is naturally on tariff risks, it is important to look at Malaysia’s domestic resilience. Fortunately, Malaysia’s decent private consumption and the continuation of mega infrastructure projects can partially offset some external risks.
All in all, we maintain our 2025 growth forecast at 4.2%, reflecting our caution on global trade prospects. We also keep our 2026 growth forecast at 3.9%.
In addition, inflation remains in check. Headline CPI decelerated to 1.5% y-o-y YTD, down from 1.8% in 2024. Given subdued inflation momentum, we keep our headline inflation forecast at 1.9% for 2025 and 1.7% for 2026. While there may be upside risks to inflation from the potential subsidy rationalisation on RON95, there have been conflicting news reports on whether this will happen as planned. Still, if international oil prices continue to fall closer to the subsidised price of MYR2.05/l, coupled with a strong ringgit, there is little need to subsidise. But these are two big assumptions.
As investors look for economies that are safe from the turmoil of tariffs, the Philippines is one of the Asian economies that comes to mind. Unfortunately, the archipelago didn’t start 2025 with a “bang”. Growth in Q1 2025 surprised to the downside, decelerating to 5.4% y-o-y. Unlike others in ASEAN, the Philippines did not benefit from importers front-loading orders in anticipation of higher tariffs.
In addition, the economy’s services exports – considered one of the two Business Process Outsourcing (BPO) capitals of the world – underperformed. From an average of c10%, growth in services exports dipped to c7%. The peso’s relative strength might have stifled the competitiveness of the sector with the Real Effective Exchange Rate (REER) floating at record-high levels, and above the REER of India, the other BPO capital of the world.
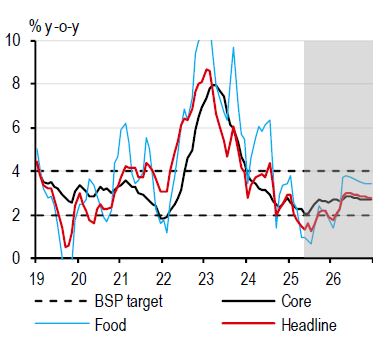
However, the prospects get better when we look under the hood – enough to stay excited about the economy. Growth in household consumption – the bulwark of the Philippine economy – finally picked up after slowing to a pace last seen during the Global Financial Crisis (GFC) as household purchasing power likely improved with inflation well below the central bank’s 2-4% target band.
With inflation down, the Bangko Sentral ng Pilipinas (BSP) is already deep within its easing cycle, cutting policy rates by as much as 125bp to 5.25%. As a result, credit growth has been “trotting” upwards from the lows of 2023. And there is much more to come with the central bank expected to ease monetary policy further, by 25bp, with risks for more cuts. The economy’s ambitious infrastructure agenda should also lend support to overall investment and, thus, growth.
On the trade front, the Philippines has the opportunity to increase its market share in the US since it has the least reciprocal tariff rate announced amongst major emerging Asian economies, at 17%. Though the final tariff rates are still fluid, the Philippines can benefit from a ‘China+1+1’ strategy since US relations may be the least contentious with the Philippines vis-à-vis other ASEAN economies.
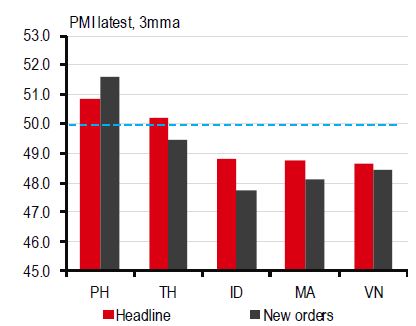
Indicators reflect this improving outlook, with the overall PMI index and new orders much better in the Philippines than in most other ASEAN economies.
Not the best start, to say the least. But we think the Philippines has the momentum, tools, and the fundamentals to power through the incoming slowdown in global growth in 2025 and beyond.
While Singapore ended 2024 on a strong footing, signs pointed to a softening economic momentum even before the tariff tensions from 2 April. Singapore’s 1Q25 GDP growth fell 0.6% q-o-q seasonally adjusted, raising the question whether Singapore will see a technical recession.
The falling GDP momentum was almost entirely due to a contraction in manufacturing, with the main culprit being volatile pharmaceutical production. In addition to manufacturing, trade-related and consumer-oriented services also saw subdued growth. This means that Singapore’s growth outlook is set to face more challenges, despite the 90-day pause in reciprocal tariffs, with the 10% baseline tariff increases already applying to all economies, except China.
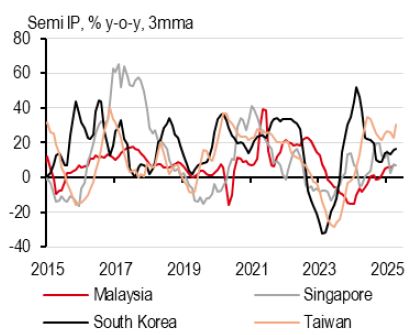
However, we do not believe Singapore is likely to enter a technical recession in 2Q25, though it may only narrowly avoid one. Thanks to some de-escalation of trade tensions and the exemption from tariffs of electronics shipments to the US, high frequency indicators have shown that front-loading activities have already taken place in April. Non-oil domestic exports (NODX) accelerated by a double-digit y-o-y rate in April alone. We expect the trend to continue for the rest of 2Q, as exporters race to front-load shipments to the US before the looming deadlines of trade negotiations on 9 July.
Despite some de-escalation around US-China trade tensions, there is not yet any clarity on the outcome. Given Singapore’s limited domestic market, its growth will be more heavily weighed down by external uncertainties than in its ASEAN peers.
All in all, we maintain our growth forecast at 1.7% for 2025, at the upper end of the government’s growth forecast range of 0-2%. We also keep our 2026 growth forecast at 1.6%.
In addition, inflation continues to make good progress. Core inflation decelerated sharply from 2.8% in 2024 to only 0.6% y-o-y YTD through April, thanks to the broad-based cooling of price pressures. Given the subdued domestic demand-induced inflation and low oil prices, we expect core inflation to come in around 0.9% for 2025 and 1.0% for 2026.
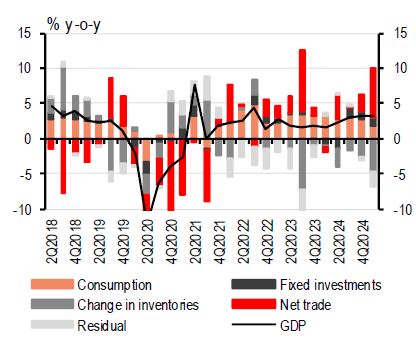
Thailand started the year strong, despite the uncertainty, with its economy growing 3.1% y-o-y in 1Q, surprising market participants. However, demand components that were expected to slow down, did taper off: private consumption decelerated as household debt tightened consumer pockets; investment cooled as trade uncertainty kept investors on the fence; and services exports substantially eased as tourism took a step back with fewer Chinese tourists visiting the region.
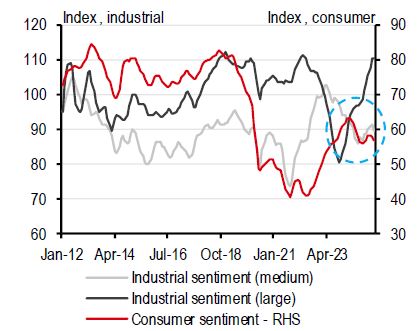
Although expected, goods exports outperformed in 1Q, growing 13.8% y-o-y. External demand, especially for chips, hard disk drives, and electrical appliances surged in anticipation of higher US tariffs. But what surprisingly boosted growth – and, perhaps, foretelling what lies ahead – was a slowdown in both goods and services imports. Goods imports decelerated to 4% y-o-y (from 9% in 4Q 2024), while services imports fell 4.3% y-o-y. Apart from household debt, households may be reeling their purchasing back in anticipation of tougher labour and business conditions, most especially for MSMEs (Micro, Small, and Medium Enterprises). In fact, the sentiment of both consumers and medium-sized firms has turned towards a declining trend, in stark contrast to the steady improvement of the sentiment amongst large-sized enterprises.
Even more telling is the continuous drawdown of inventories, which have fallen year-on-year 13 times during the last 16 months. Households and business owners may already be gearing for growth to take a hit in the months ahead.
Reciprocal tariffs by the US, of course, will be the biggest drag, with the US being Thailand’s largest destination for exports. Though nobody is truly certain about what the final outcome will be on tariffs, the final tariff rate for Thailand will be important; we estimate that every 10ppt tariff imposed on Thailand will decrease its GDP growth by 0.5ppt.
Indirect effects also matter. US tariffs on China will likely lead to China redirecting its exports to ASEAN, toughening competition in the region. Thailand, then, finds itself in a perilous situation. China’s oversupply of goods is highly concentrated in those that Thailand also produces, such as car parts and electrical appliances. This, in turn, provides deflationary pressure on the economy.
Assuming that reciprocal tariff rates are lowered after the 90-day pause, we expect growth to clock in a tepid pace of 1.7% in 2025, and then, marginally improve to 1.9% in 2026.
After decent growth of 6.9% y-o-y in 1Q25, Vietnam is bracing for more trade volatility. That said, the 90-day pause on “reciprocal tariffs” until 9 July is a much welcome reprieve, with high frequency indicators showing strong front-loading activities in 2Q25.
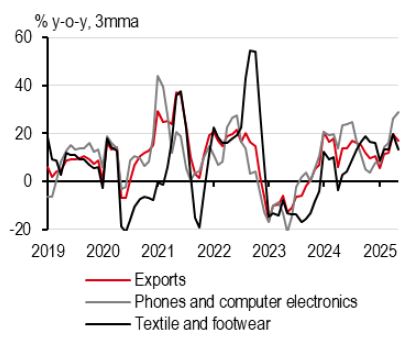
Export growth rallied to c20% y-o-y in April and May, half of which was thanks to the frontloading of non-phone electronics shipments. That said, imports also surged by a similar magnitude, leading to a rather marginal trade surplus of only USD600m per month on average.
However, the clock is ticking, as the global trade outlook remains highly uncertain. News reports suggest that Vietnam is set to purchase US agriculture imports worth of USD2bn (The Investor, 3 June). However, details on where the trade negotiations are heading remain scarce.
Since the tariff turmoil in April, there has been greater urgency by policymakers to strengthen efforts to support the domestic economy. Major infrastructure projects are being completed, such as Tan Son Nhat International Airport’s Terminal 3 in Ho Chi Minh City, while more are in the pipeline, such as the USD8bn Lao Cai – Hanoi – Hai Phong railway (Vietnamplus, 20 May).
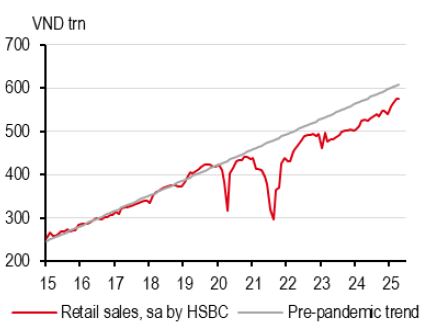
Encouragingly, the domestic sector is showing signs of improvement, with retail sales picking up. Vietnam has also seen the strongest recovery in international tourists YTD in the region. All in all, we maintain our growth forecast at 5.2% in 2025 and 5.6% in 2026, although we note how US trade policy outcomes settle can heavily swing Vietnam’s growth trajectory.
Outside of growth, inflation has decelerated from 3.6% in 2024 to 3.2% y-o-y YTD through May. The underlying trend remains benign and is well below the State Bank of Vietnam’s (SBV) inflation target ceiling of 5.0%. With global energy prices continuing their downtrend, we maintain our inflation forecast at 3.0% for 2025 and 3.2% for 2026.
Additional disclosures
1. This report is dated as at 26 June 2025.
2. All market data included in this report are dated as at close 25 June 2025, unless a different date and/or a specific time of day is indicated in the report.
3. HSBC has procedures in place to identify and manage any potential conflicts of interest that arise in connection with its Research business. HSBC's analysts and its other staff who are involved in the preparation and dissemination of Research operate and have a management reporting line independent of HSBC's Investment Banking business. Information Barrier procedures are in place between the Investment Banking, Principal Trading, and Research businesses to ensure that any confidential and/or price sensitive information is handled in an appropriate manner.
4. You are not permitted to use, for reference, any data in this document for the purpose of (i) determining the interest payable, or other sums due, under loan agreements or under other financial contracts or instruments, (ii) determining the price at which a financial instrument may be bought or sold or traded or redeemed, or the value of a financial instrument, and/or (iii) measuring the performance of a financial instrument or of an investment fund.
This document is prepared by The Hongkong and Shanghai Banking Corporation Limited (‘HBAP’), 1 Queen’s Road Central, Hong Kong. HBAP is incorporated in Hong Kong and is part of the HSBC Group. This document is distributed by HSBC Bank Canada, HSBC Continental Europe, HBAP, HSBC Bank (Singapore) Limited, HSBC Bank (Taiwan) Limited, HSBC Bank Malaysia Berhad (198401015221 (127776-V))/HSBC Amanah Malaysia Berhad (200801006421 (807705-X)), The Hongkong and Shanghai Banking Corporation Limited, India (HSBC India), HSBC Bank Middle East Limited, HSBC UK Bank plc, HSBC Bank plc, Jersey Branch, and HSBC Bank plc, Guernsey Branch, HSBC Private Bank (Suisse) SA, HSBC Private Bank (Suisse) SA DIFC Branch, HSBC Private Bank Suisse SA, South Africa Representative Office, HSBC Financial Services (Lebanon) SAL, HSBC Private banking (Luxembourg) SA and The Hongkong and Shanghai Banking Corporation Limited (collectively, the “Distributors”) to their respective clients. This document is for general circulation and information purposes only. This document is not prepared with any particular customers or purposes in mind and does not take into account any investment objectives, financial situation or personal circumstances or needs of any particular customer. HBAP has prepared this document based on publicly available information at the time of preparation from sources it believes to be reliable but it has not independently verified such information. The contents of this document are subject to change without notice. HBAP and the Distributors are not responsible for any loss, damage or other consequences of any kind that you may incur or suffer as a result of, arising from or relating to your use of or reliance on this document. HBAP and the Distributors give no guarantee, representation or warranty as to the accuracy, timeliness or completeness of this document. Thisdocument is not investment advice or recommendation nor is it intended to sell investments or services or solicit purchases or subscriptions for them. You should not use or rely on this document in making any investment decision. HBAP and the Distributorsare not responsible for such use or reliance by you. You should consult your professional advisor in your jurisdiction if you have any questions regarding the contents of this document. You should not reproduce or further distribute the contents of this document to any person or entity, whether in whole or in part, for any purpose. This document may not be distributed to any jurisdiction where its distribution is unlawful.
The following statement is only applicable to HSBC Bank (Taiwan) Limited with regard to how the publication is distributed to its customers: HSBC Bank (Taiwan) Limited (“the Bank”) shall fulfill the fiduciary duty act as a reasonable person once in exercising offering/conducting ordinary care in offering trust services/business.
However,the Bank disclaims any guaranty on the management or operation performance of the trust business. The following statement is only applicable to by HSBC Bank Australia with regard to how the publication is distributed to itscustomers: This document is distributed by HSBC Bank Australia Limited ABN 48 006 434 162, AFSL/ACL 232595 (HBAU). HBAP has a Sydney Branch ARBN 117 925 970 AFSL 301737.The statements contained in this document are general in nature and do not constitute investment research or a recommendation, or a statement of opinion (financial product advice) to buy or sell investments. This document has not taken into account your personal objectives, financial situation and needs. Because of that, before acting on the document you should consider its appropriateness to you, with regard to your objectives, financial situation, and needs.
Important Information about the Hongkong and Shanghai Banking Corporation Limited, India (“HSBC India”)
HSBC India is a branch of The Hongkong and Shanghai Banking Corporation Limited. HSBC India is a distributor of mutual funds and referrer of investment products from third party entities registered and regulated in India. HSBC India does not distribute investment products to those persons who are either the citizens or residents of United States of America (USA), Canada, Australia or New Zealand or any other jurisdiction where such distribution would be contrary to law or regulation.
Mainland China
In mainland China, this document is distributed by HSBC Bank (China)Company Limited (“HBCN”) and HSBC FinTech Services (Shanghai) Company Limited to its customers for general reference only. This document is not, and is not intended to be, for the purpose of providing securities and futures investment advisory services orfinancial information services, or promoting or selling any wealth management product. This document provides all content and information solely on an "as-is/as-available" basis. You SHOULD consult your own professional adviser if you have any questions regarding this document.
The material contained in this document is for general information purposes only and does not constitute investment research or advice or a recommendation to buy or sell investments. Some of the statements contained in this document may be considered forward looking statements which provide current expectations or forecasts of future events. Such forward looking statements are not guarantees of future performance or events and involve risks and uncertainties. Actual results may differ materially from those described in such forward-looking statements as a result of various factors. HSBC India does not undertake any obligation to update the forward-looking statements contained herein, or to update the reasons why actual resultscould differ from those projected in the forward-looking statements. Investments are subject to market risk, read all investment related documents carefully.
© Copyright 2024. The Hongkong and Shanghai Banking Corporation Limited, ALL RIGHTS RESERVED.
No part of this document may be reproduced, stored in a retrieval system, or transmitted, on any form or by any means, electronic, mechanical, photocopying, recording or otherwise, without the prior written permission of The Hongkong and Shanghai Banking Corporation Limited.
Important information on sustainable investing
“Sustainable investments” include investment approaches or instruments which consider environmental, social, governance and/or other sustainability factors (collectively, “sustainability”) to varying degrees. Certain instruments we include within this category may be in the process of changing to deliver sustainability outcomes.
There is no guarantee that sustainable investments will produce returns similar to those which don’t consider these factors. Sustainable investments may diverge from traditional market benchmarks.
In addition, there is no standard definition of, or measurement criteria for sustainable investments, or the impact of sustainable investments (“sustainability impact”). Sustainable investment and sustainability impact measurement criteria are (a) highly subjective and (b) may vary significantly across and within sectors.
HSBC may rely on measurement criteria devised and/or reported by third party providers or issuers. HSBC does not always conduct its own specific due diligence in relation to measurement criteria. There is no guarantee: (a) that the nature of the sustainability impact or measurement criteria of an investment will be aligned with any particular investor’s sustainability goals; or (b) that the stated level or target level of sustainability impact will be achieved.
Sustainable investing is an evolving area and new regulations may come into effect which may affect how an investment is categorised or labelled. An investment which is considered to fulfil sustainable criteria today may not meet those criteria at some point in the future.